The Question
I’m curious about how AI and LLMs are affecting software development, and in particular, how they are speeding up discovery of issues, bugs, and vulnerabilities. I also have at least some concern that this increase in the rate of bugs and vulnerabilities being found will overwhelm the ability of software maintainers to patch their software in a timely manner. If you’re reliant in any way on technology and software, I’d imagine that you have similar concerns!
Case in point - Anthropic held off on releasing Mythos, an LLM which they developed and were going to make available in April 2026. They delayed the release with the stated reasoning being that their latest (at the time) technology and models were so good that they represented a threat to our global software ecosystem. They believed Mythos would enable bad actors to find more new latent bugs and security issues quickly enough that they would overwhelm development teams before they would be able to fix them. There was some skepticism that this was a marketing trick (“Our new technology is so amazing and powerful we can’t actually give it to you because it’s too amazing and powerful!”) but at the time it was hard to be sure.
As an empirical thinker, and, more specifically, a professional in a field based on rigorous usage of data and numerical analysis to validate or disprove conclusions, I would like to investigate this phenomenon of LLM impact on software development. Can we somehow verify or disprove in a systematic way that:
- LLMs/AI are finding more bugs more quickly than was previously happening without AI assistance?
- That these bugs are not just “slop” bug reports and/or very rare corner cases, but actually represent real issues that need to be addressed?
- Can we measure the specific impact of these trends over time? Are the number of bug reports and fixes increasing 50%? 100%? 200%?
Why Postgres
I found an example of this recently (early September 2026). Postgres is an open-source relational database which I use frequently, and the changelog for the most recent minor patch, 18.6, seemed to be significantly larger than I’ve seen in previous minor changelog releases. I also noticed that it seemed to have a high volume of security issues being fixed.
Postgres has been running as an open source project for about 20 years. It’s so widely used and so capable that there is a meme called “Just Use Postgres” to represent that it can, by itself, do at least moderately well what umpteen other more specialized database platforms and analytics tools are created to do. Given its long project history, its open and transparent product approach to coding and project communications, and its wide usage and importance to the overall software ecosystem, I think that it is a great test case for this hypothesis.
How Postgres Ships Software
A few things we need to get clear about Postgres’ versioning policy and how they release software in order to understand how to appropriately explore the question.
- The Postgres development team releases a new major release every year. New functionality is limited to major releases.
- The most recent major release is 18. 19 is being worked on, is in beta, and will be released later this year.
- Major releases are supported for 5 years. “Supported” means that bugs and vulnerabilities will be backpatched to supported major releases for that period. Therefore, version 14 will have its final minor release on November 12th, 2026 and will not be patched or supported afterwards.
- Minor releases to supported major releases happen every quarter.
- Minor releases are only for bugfixes and vulnerabilities; new functionality is only added to major releases.
- Minor releases for all supported major releases are coordinated and happen at the same time.
- So, for example, minor releases 18.6, 17.11, 16.15, 15.19, and 14.24 were released on August 13th, 2026. The next minor release will occur on November 12th, 2026.
- There are occasional “out-of-band” minor releases due to an important bugfix or security issue which happen as necessary. There have been a few of these over previous years, but they’ve been infrequent enough and small enough that we’re going to exclude them from our analysis.
We’re interested in the rate of reported and fixed bugs and vulnerabilities and how that changes over time. Therefore, what we care about are minor releases as they only contain fixes for bugs and vulnerabilities. We’re not going to look at the contents of major releases because it’s more difficult with them to parse out what was new functionality versus what was a bugfix or an addressed vulnerability.
The Data Sources
What data sources are available for analysis purposes? Well, there are a few:
- The postgres git repo: https://github.com/postgres/postgres. This is where you can see every commit made to the codebase, every file changed, by whom, when, for what reason.
- This also has within it a more easily machine-readable version of the Postgres changelog reports so that it’s not necessary to process them as a separate datasource.
- The postgres mailing lists and their archives. The archives are downloadable. For example, here are the downloadable archives for the pgsql-hackers list: https://www.postgresql.org/list/pgsql-hackers/
- The project has a very explicit policy that all emails sent are permanently publicly visible and irrevocable, so it seems ethically acceptable to me to use the email archives for analysis.
- Postgres Common Vulnerability and Exposure reports, downloadable here: https://www.postgresql.org/support/security/?cve=title.
- For those not familiar - one common method to document vulnerabilities in modern, widely used software is via Common Vulnerabilities and Exposures, also known as CVEs.
- One reason that this is useful for our purposes is that it deduplicates what might be potentially multiple different bug reports from different sources into one vulnerability.
- It also represents a validation of a bug report - if something has been assigned a CVE, it’s been examined by the developers of a piece of software and determined to be an actual vulnerability. It filters out the potential AI slop and/or lazy “seems to be a vulnerability but really isn’t” cases.
Changelog Entries per Release
Using these datasources, let’s count the number of Postgres release changelog entries by year and quarterly release:
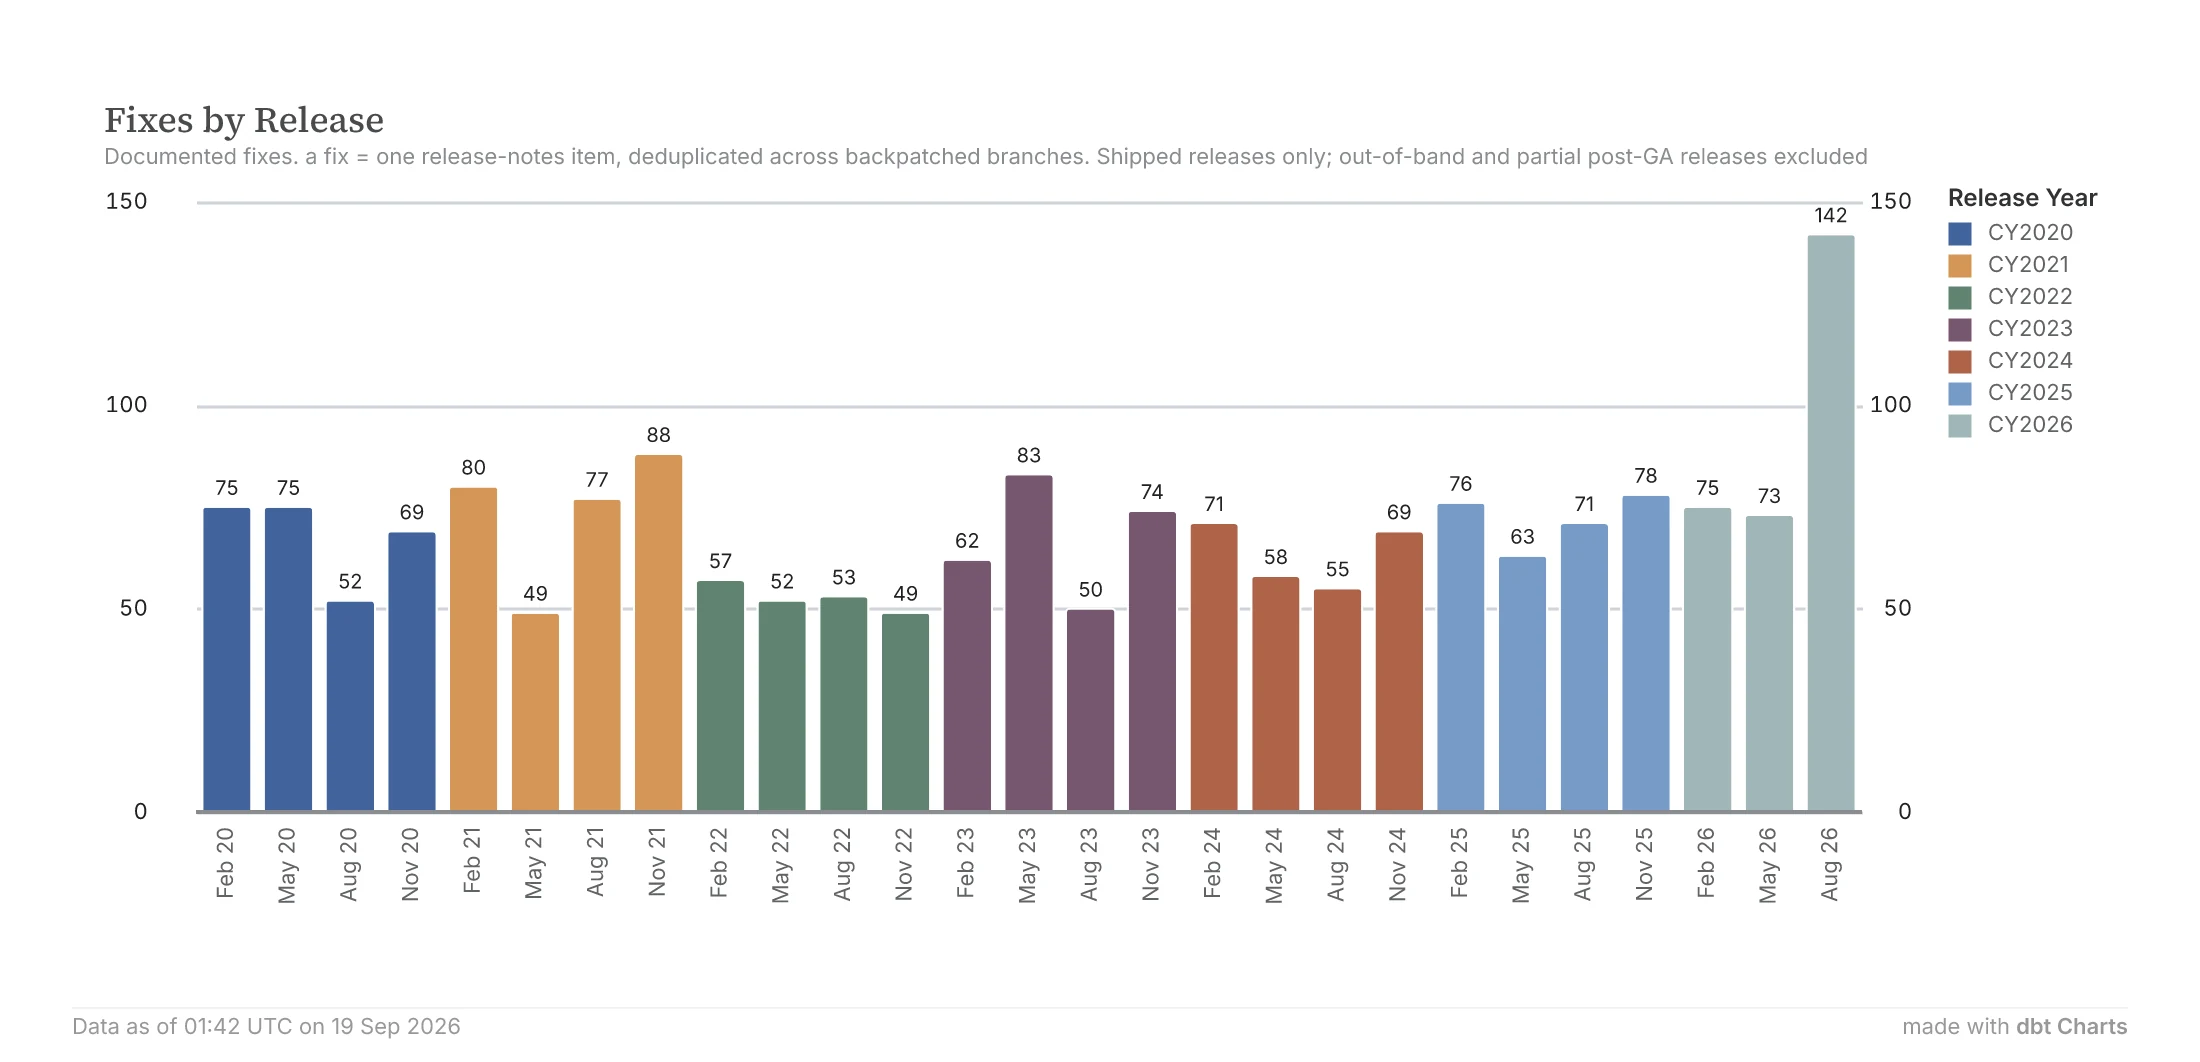
As you can see, the number of changelog entries has varied somewhat since February 2020, with some quarters going as low as 49 (May 2021 and again November 2022) and as high as 88 (November 2021). 2025 and 2026 had been relatively constant, moving between 63 and 78, up until the August 2026 release which jumped to 142 changelog entries. So, roughly doubling from the previous quarterly release. This at least validates my observation that the number of changelog entries has increased significantly compared to previous quarterly releases. However, there’s only a loose causal link with the hypothesis that LLMs are the cause of this in the sense that that timeframes coincide in that it’s in the last 3 or 4 months that LLMs really seem to be exploding into the software space. We need some much stronger evidence that LLMs are the cause, or at least a significant contributor.
CVEs per Release
One other way to validate the hypothesis would be to look at the number of changelog entries that are associated with a documented security issue. If we see an increase in the number of security issues found in an absolute sense, and also as a proportion of the number of changelog entries reported, it’s likely that LLMs are contributing to the rate of discovery of issues. Let’s use the Postgres reported CVEs to count this. Here is a chart with the same timespan and count of changelog items since Q1 2020, but this time let’s categorize whether the changelog item was related to a CVE or not. Also, let’s look at the % of changelog items over time associated with CVEs.
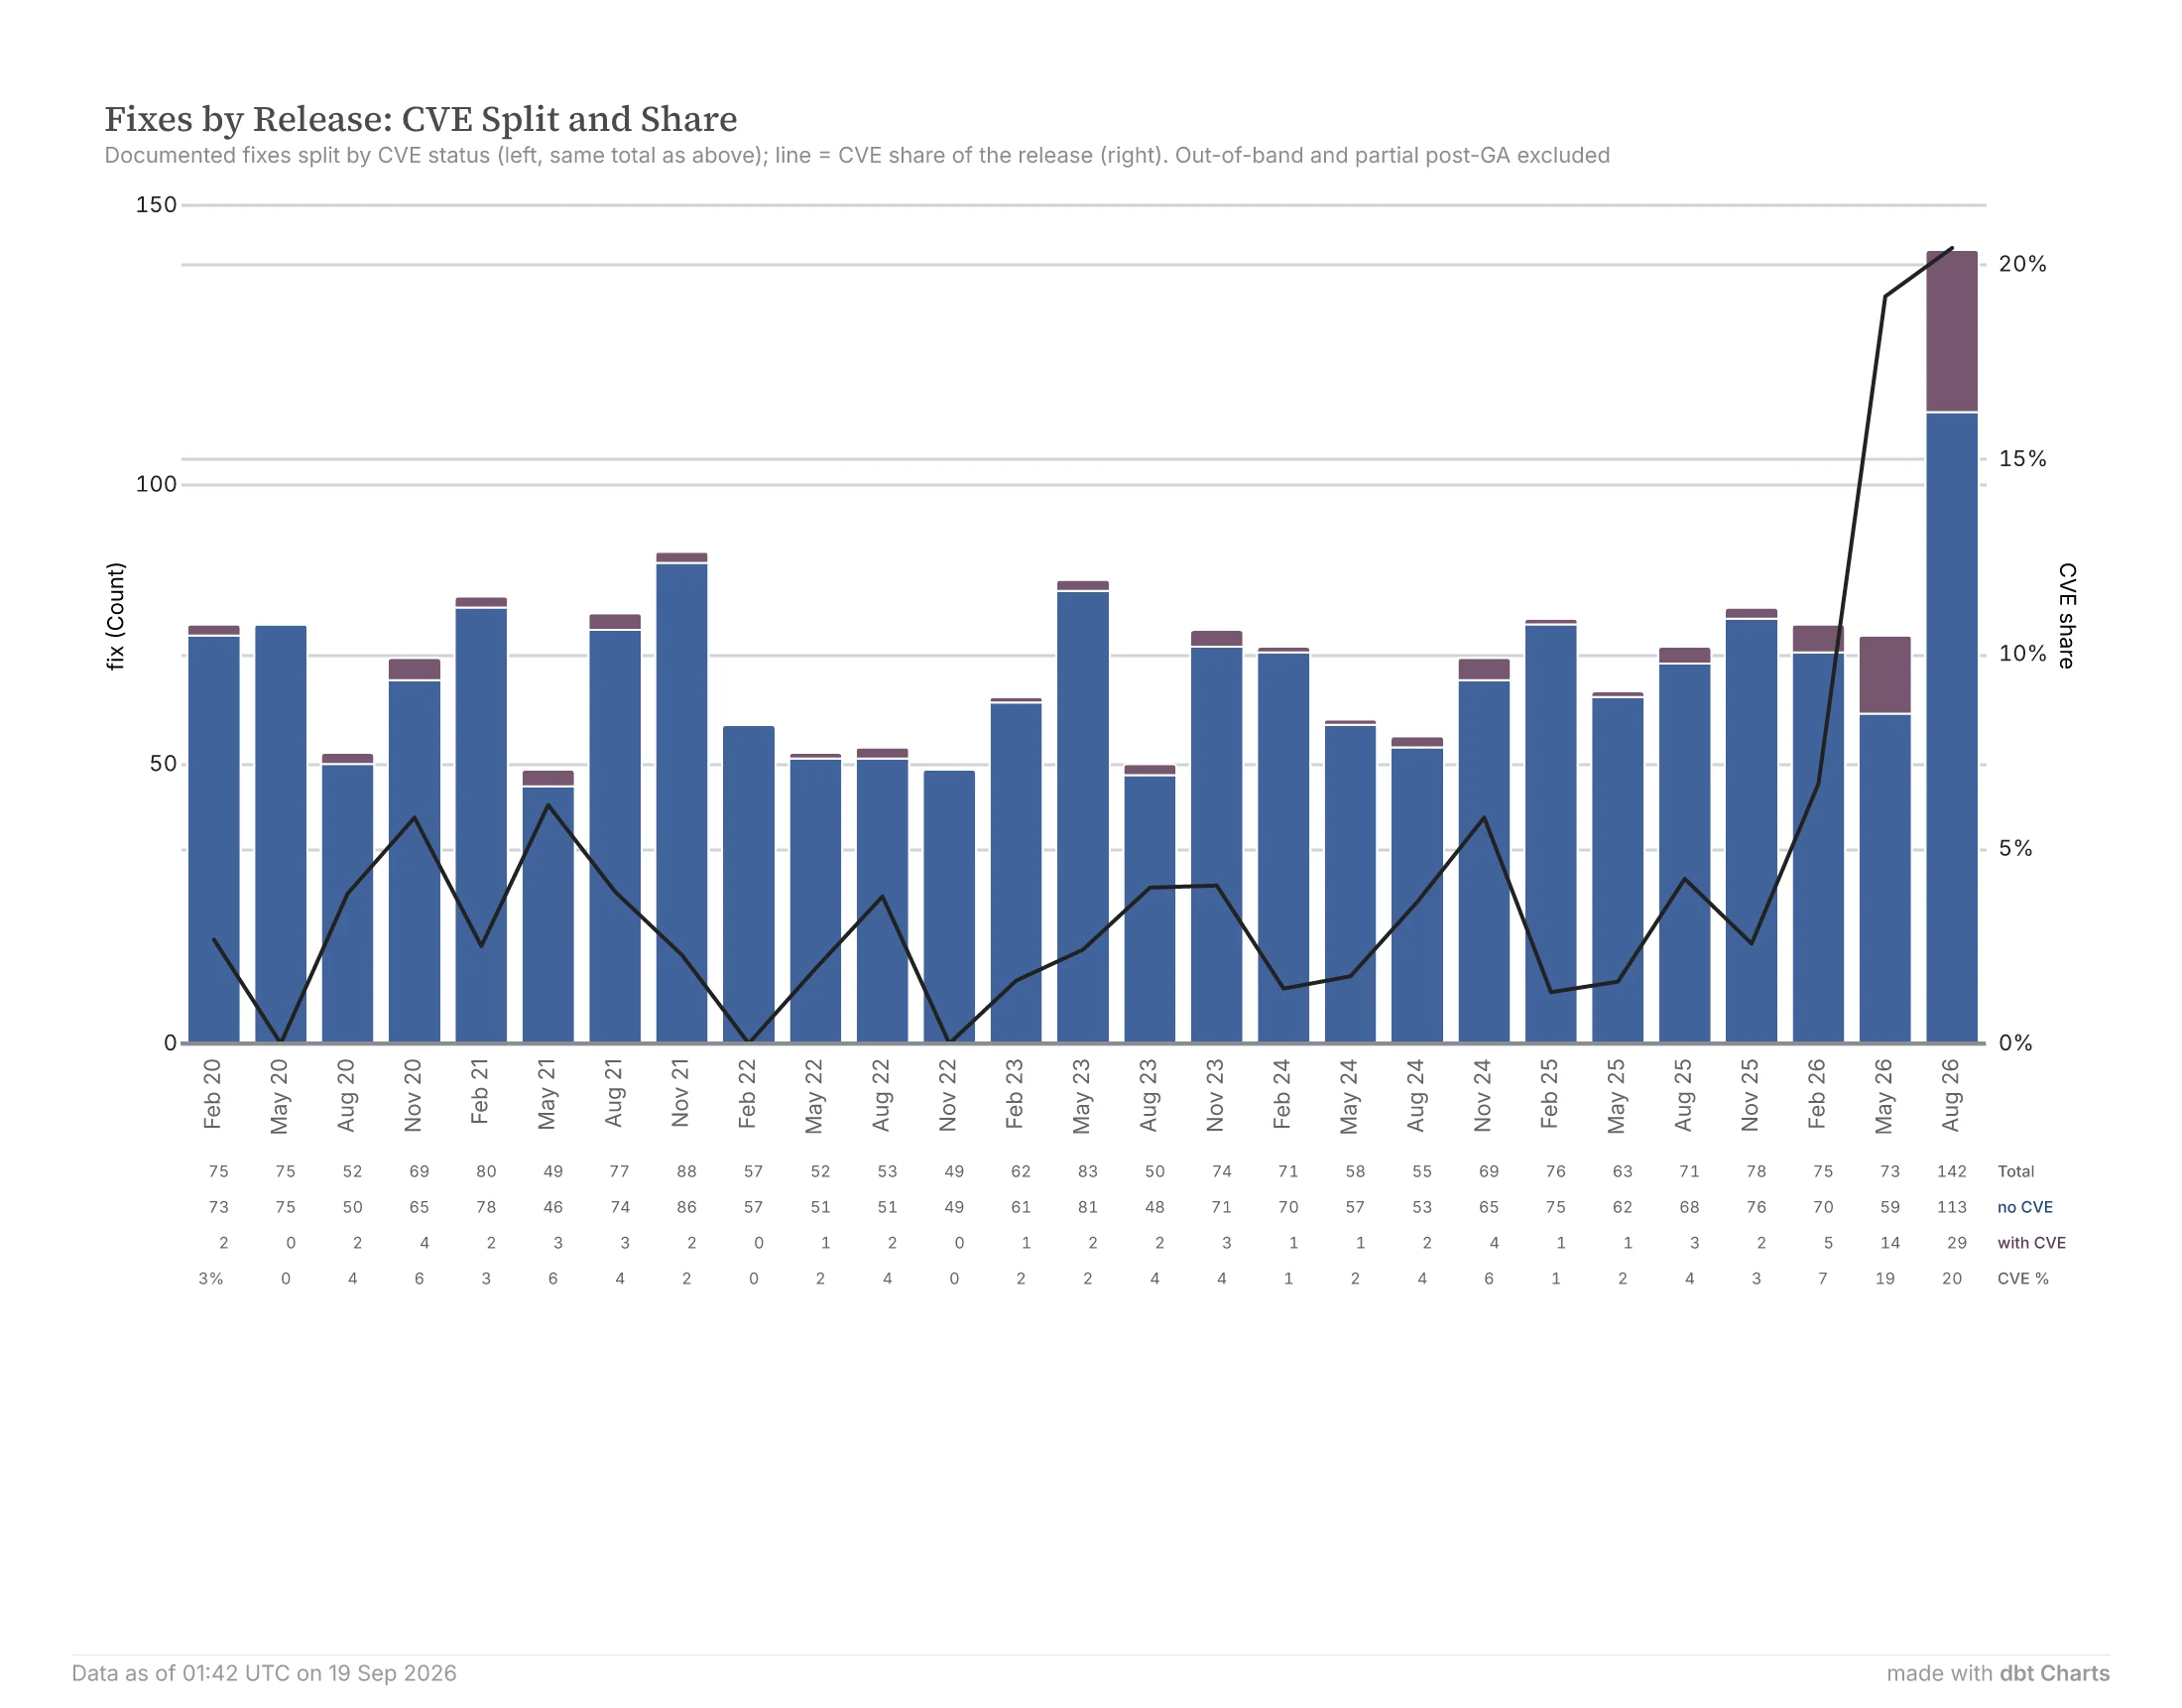
So, we’re clearly seeing an increase in the number of changelog items assigned a CVE for the last two quarters - the May and August 2026 releases. Historically it averaged around 2 or maybe 3 a quarter, then jumped to 14 and then 29 for May and August 2026, respectively. Also, the proportion of changelog entries that are assigned CVEs was historically in the 0 to 6% range, and in the last two quarters it jumped to 19% and then 20%.
Of 26 fix commits in the Postgres git repository that disclose AI involvement (all since April 2026), 22 credit an AI tool with finding the bug the commit fixes. The credits name OpenAI Codex Security, Anthropic’s Claude (via Calif.io), and Xint Code. A good share of May’s and August’s CVE fixes trace to these commits. The commits provide fixes like overflow guards, buffer checks, and recursion limits. The majority of these commits which disclose AI involvement land in two batches in the final days before the May and August releases.
Mailing List Traffic
Is there another way we could validate our hypothesis? Well, I would assume that the number of bugs reported would increase, and overall mailing list or discussion thread volume would also increase if LLMs are making it easier to find and report bugs. How does the Postgres project handle communications?
- Postgres has many email mailing lists, but two of the largest and most relevant for our purposes are pgsql-hackers (“The PostgreSQL developers team lives here. Discussion of current development issues, problems and bugs, and proposed new features.”) and pgsql-bugs (for bug discussion).
- The project asks that all bugs be submitted via the bug reporting form here: https://www.postgresql.org/account/submitbug/
- There is an exception for security-related issues, which they ask to be reported to a special email address (security@postgresql.org). Security-related bugs are not publicly discussed and are embargoed until the quarterly release to attempt to reduce the need for more frequent out-of-band patches.
- Bugs submitted via the bug reporting form are then automatically mailed to the pgsql-bugs mailing list and start a discussion thread. However, I have found that there is an ongoing proportion of bugs which are reported by Postgres users and/or developers by directly emailing the pgsql-bugs mailing list without filing a formal bug report. We’ll dig more into this below.
Let’s then look at two things to see if there is an obvious LLM impact. What does the current and historical volume of a) traffic on these mailing lists and b) the number of reported bugs, look like?
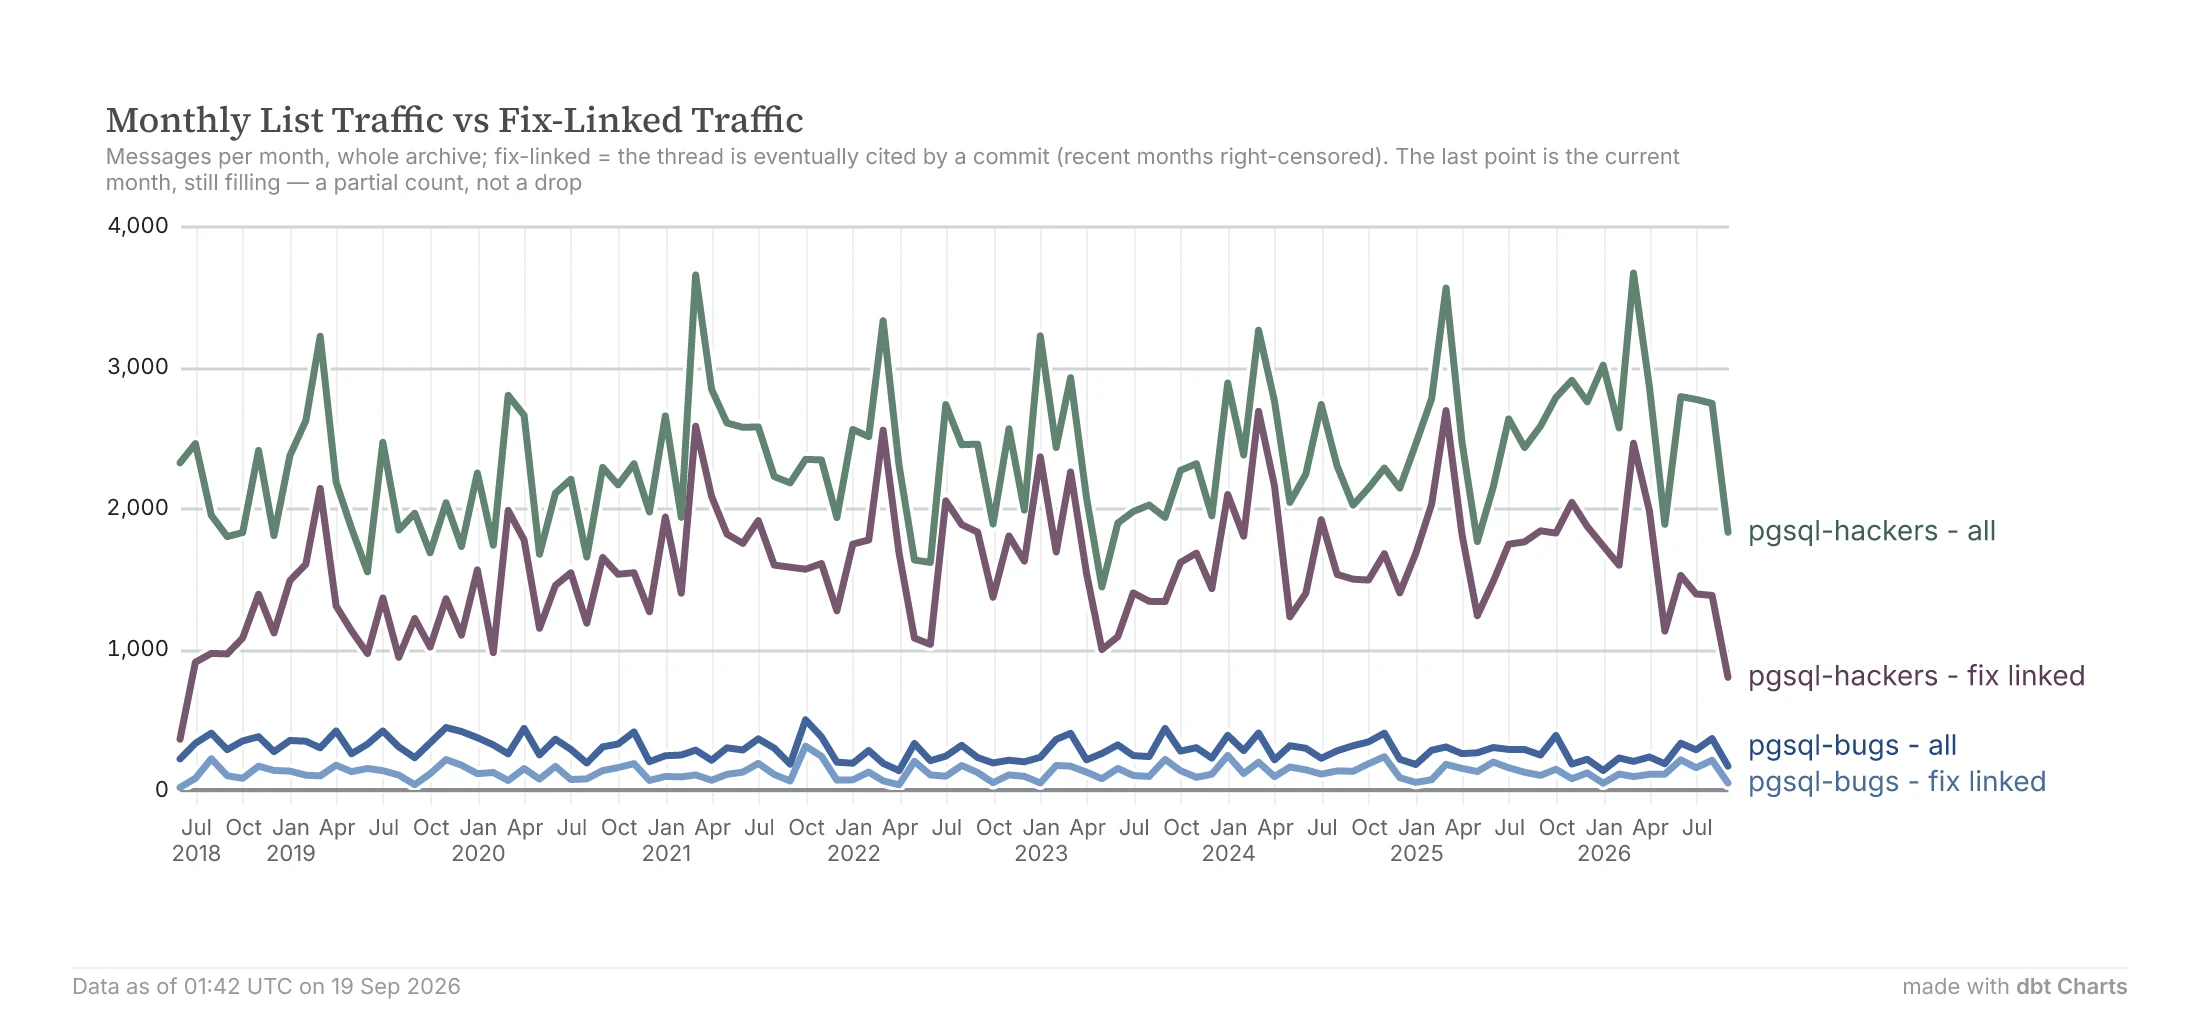
This is interesting - there doesn’t seem to be an obvious jump in the number of emails sent on either the pgsql-hackers or the pgsql-bugs lists in the last three to six months when comparing to the trend over the last 8 years or so. While the chart is a bit spiky, what I’m seeing for the last few months seems to be relatively consistent with previous years. As an aside, there does seem to be some interesting seasonality with a spike in email traffic every March, but I’m going to try to be disciplined and not get too distracted by that.
If we were to dig in and look specifically at the percent of each month’s messages which are mentioned in commit-cited threads, are there any interesting patterns there?
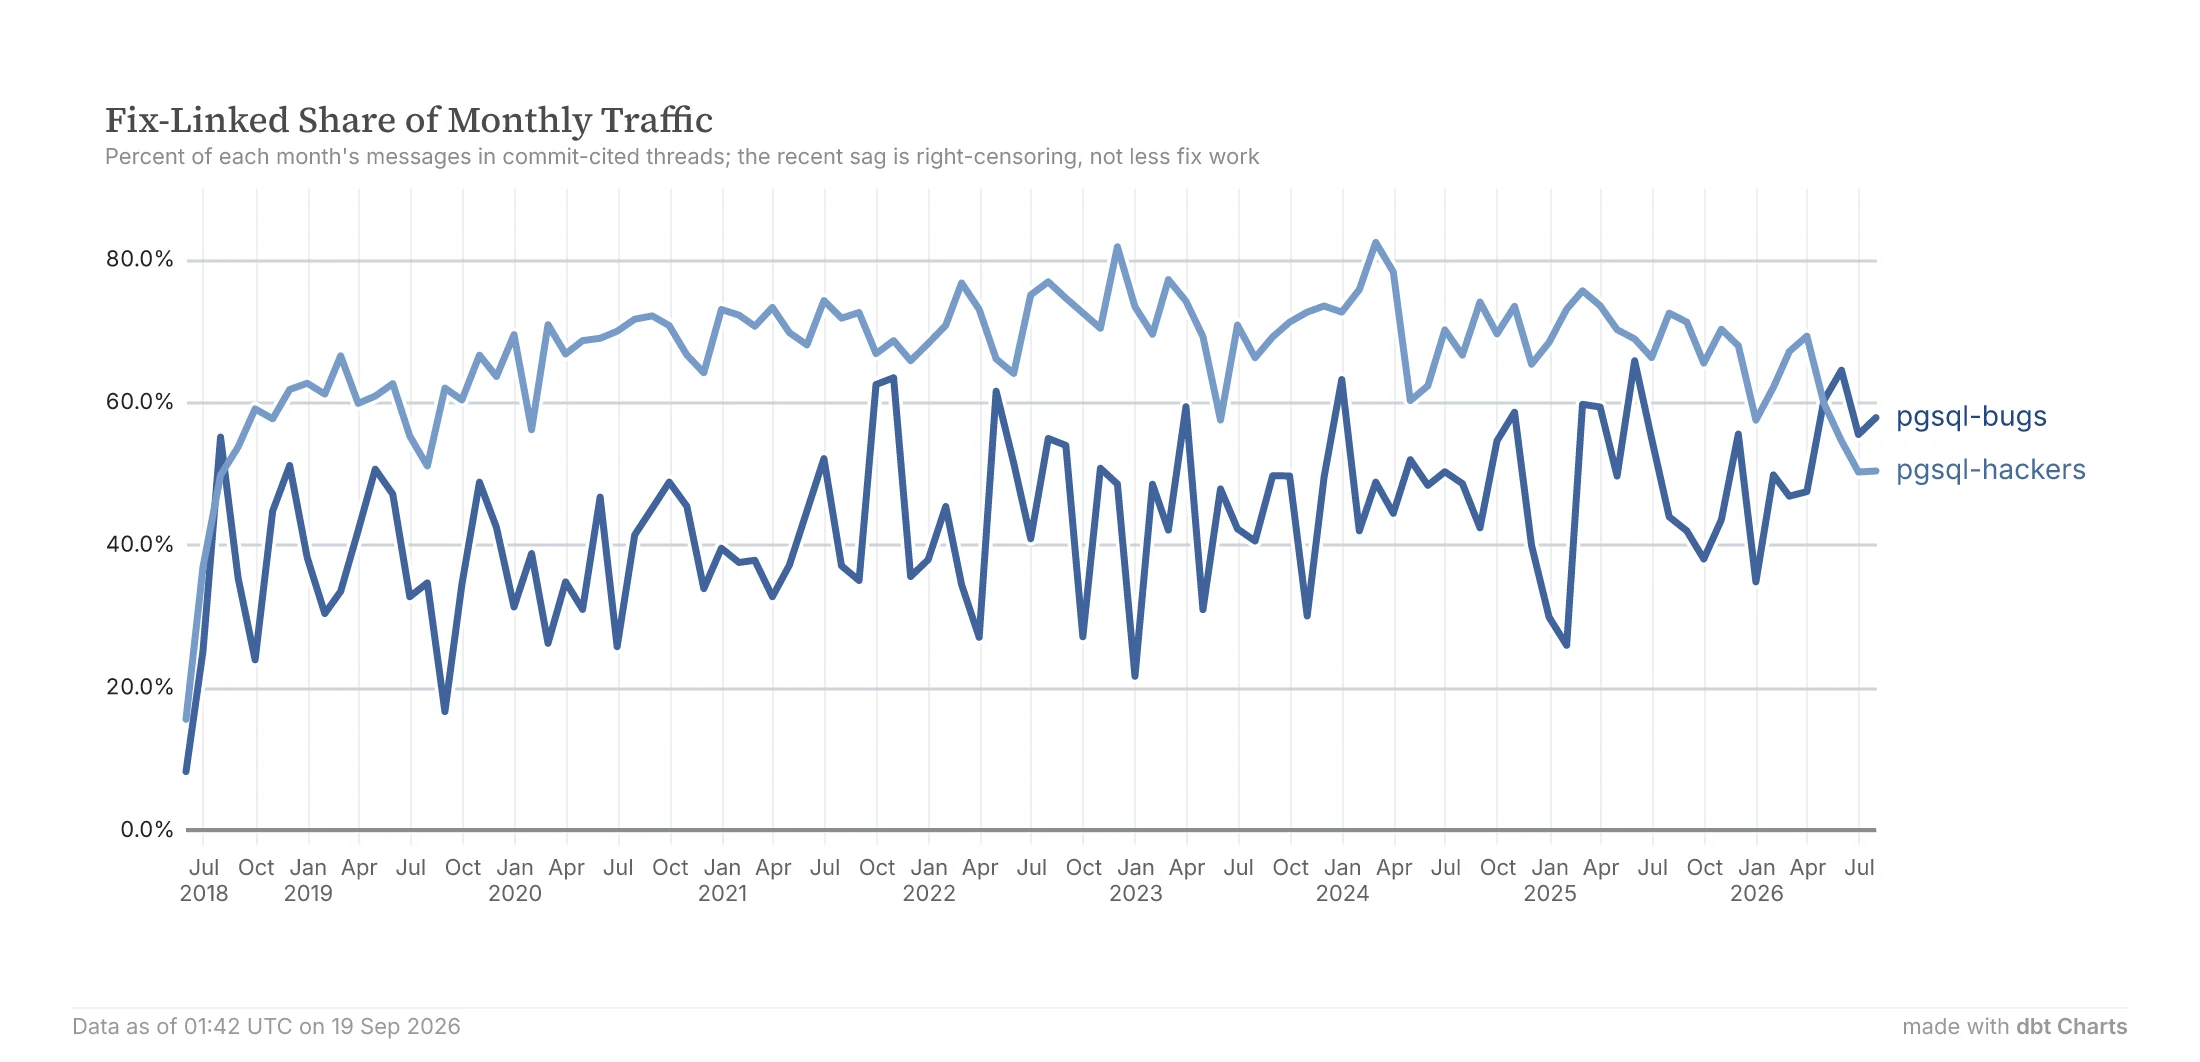
There does seem to be an uptick in the proportion of messages in commit-cited threads for the pgsql-bugs list starting in May of 2026, but it’s not as striking as the previous charts that we looked at. Pgsql-hackers does appear to drop from May 2026, but there is a confounding factor. It takes time for a thread to be cited by a commit, so the last few months of this chart will always read lower than they eventually will. There also does seem to be a slow long-term growth of the proportion for the pgsql-bugs list but that’s too long of a time horizon to be related to LLMs. So there’s not strong evidence here.
Threads That Disclose AI Involvement
Is there a way to actually look at emails/threads and see if there is mention of AI made in them via one way or another? Whether in assistance finding the issue, analyzing it, writing code, or something else? Non-statistical methods like scanning for hardcoded strings or using regular expressions tend to be fragile and arbitrary - e.g. if you were searching for “Claude” in your pattern but not “Codex” you’d miss some of them. What about if we actually used an LLM to classify an email as to whether it had any mention of AI? Following this idea, I went ahead and used a local LLM (Qwen3, running through Ollama) to classify the mailing list messages after tuning the prompt against a hand-labelled sample and then reviewing every positive by hand. More specifically, I looked at the first message which starts a thread on the two mailing lists. I only looked at the first message because we’re mostly concerned about whether AI has had a hand in finding or analyzing a potential bug or vulnerability, or writing the suggested patch to fix it. This is going to come up in the first message. It’s also somewhat computationally expensive (relatively, compared to, say, running a SQL query) to use an LLM to analyze these messages so it helps to reduce the volume of messages that we need to scan.
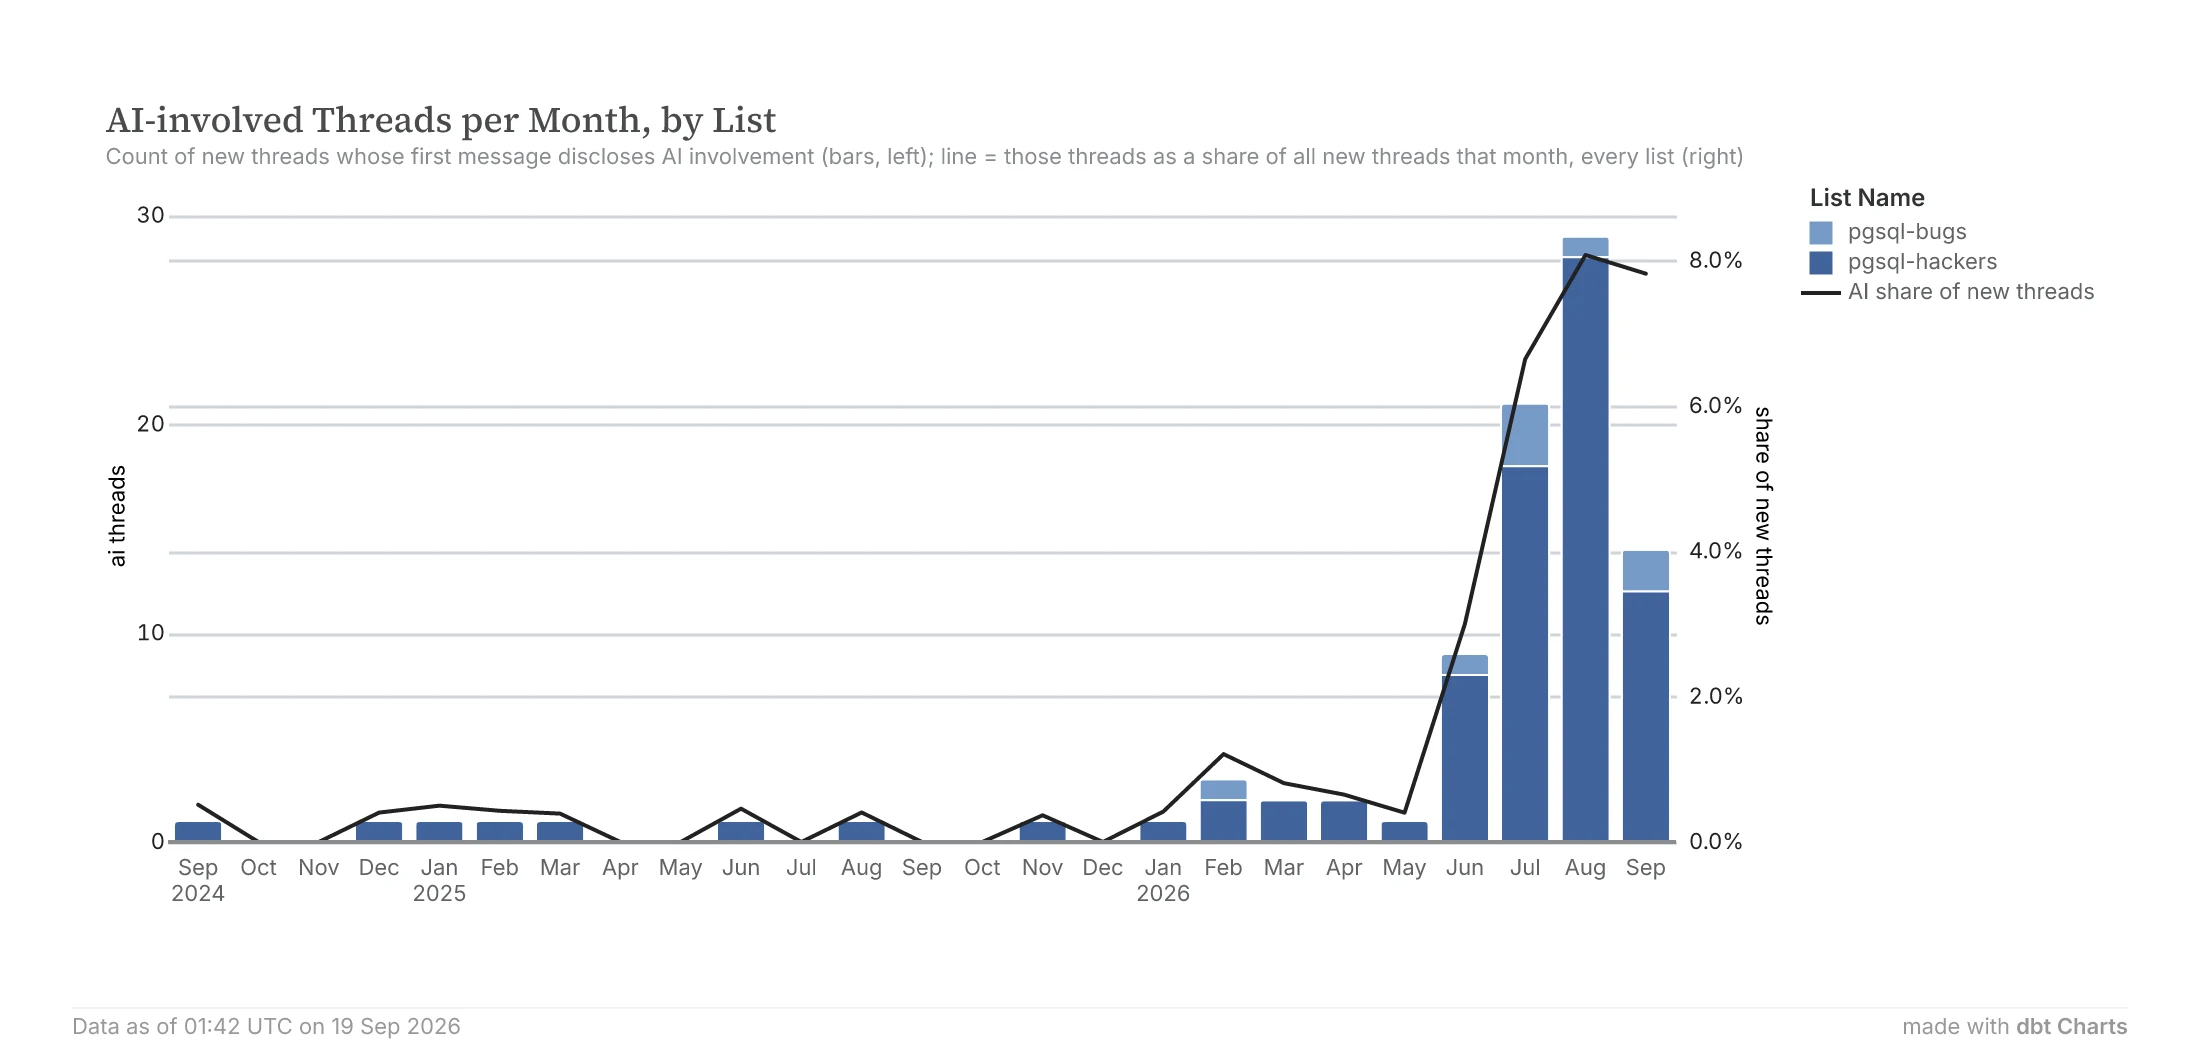
The first potential mention of AI in mailing list threads comes in September 2024 on the pgsql-hackers list, in this message. The real volume ramp-up starts in June of 2026, and continues growing into August which had 29 AI-involved threads started, representing 8% of the total threads started that month. September’s share is already at 8% which is consistent with August’s share even though the thread volume is only at half.
Bug Reports
What about bug reports? Do we see a significant increase in numbers of reported bugs, whether via the reporting form or direct mailing to the pgsql-bugs mailing list?
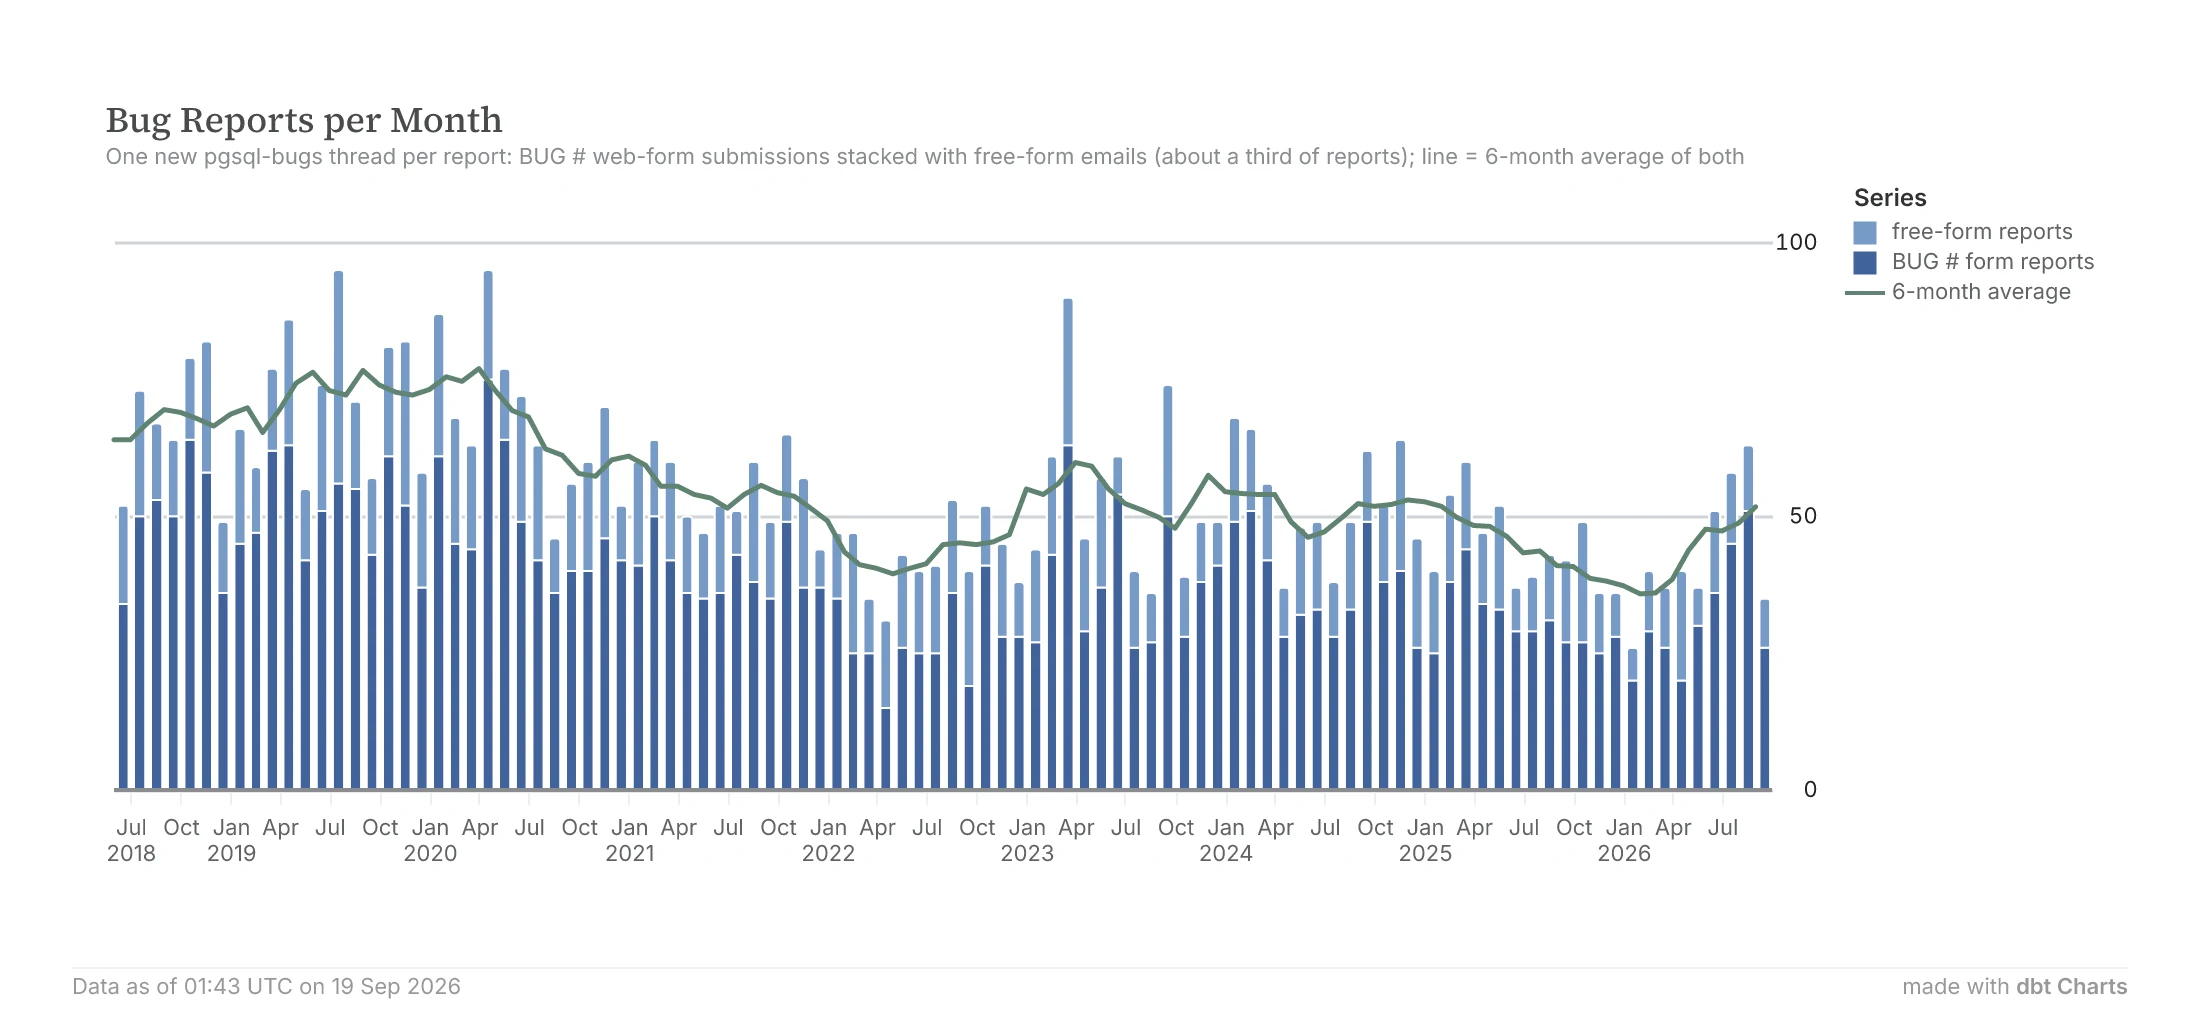
There is a recent uptick starting in June 2026, and increasing through August 2026. September 2026 is much less, but that’s because it’s an incomplete month so you can’t really count the last bar. However, if you look at the 6-month rolling average, it’s returning more back to levels that it occupied through much of 2023 through early 2025. And bug reports were significantly higher in 2018 through 2020. So there’s not really a strong argument here for or against LLMs affecting total volume of bug reports - it appears more like there are some other cyclical factors affecting long-term bug reporting volume that I haven’t yet identified.
This chart also breaks down the number of bug reports filed via the bug reporting form versus a direct email to the pgsql-bugs mailing list, and it’s interesting to see that, based on pure eyeballing of the chart, that in any given month it’s usually ⅔ to ¾ of all bugs are reported via the bug reporting form and ⅓ to ¼ via direct mail to the pgsql-bugs mailing list.
Bug Reports Acted Upon
One objection comes to mind - even if the total volume of bug reports may not have changed that much, is the proportion of bug reports being addressed changing? In a way that would seem related to LLMs?
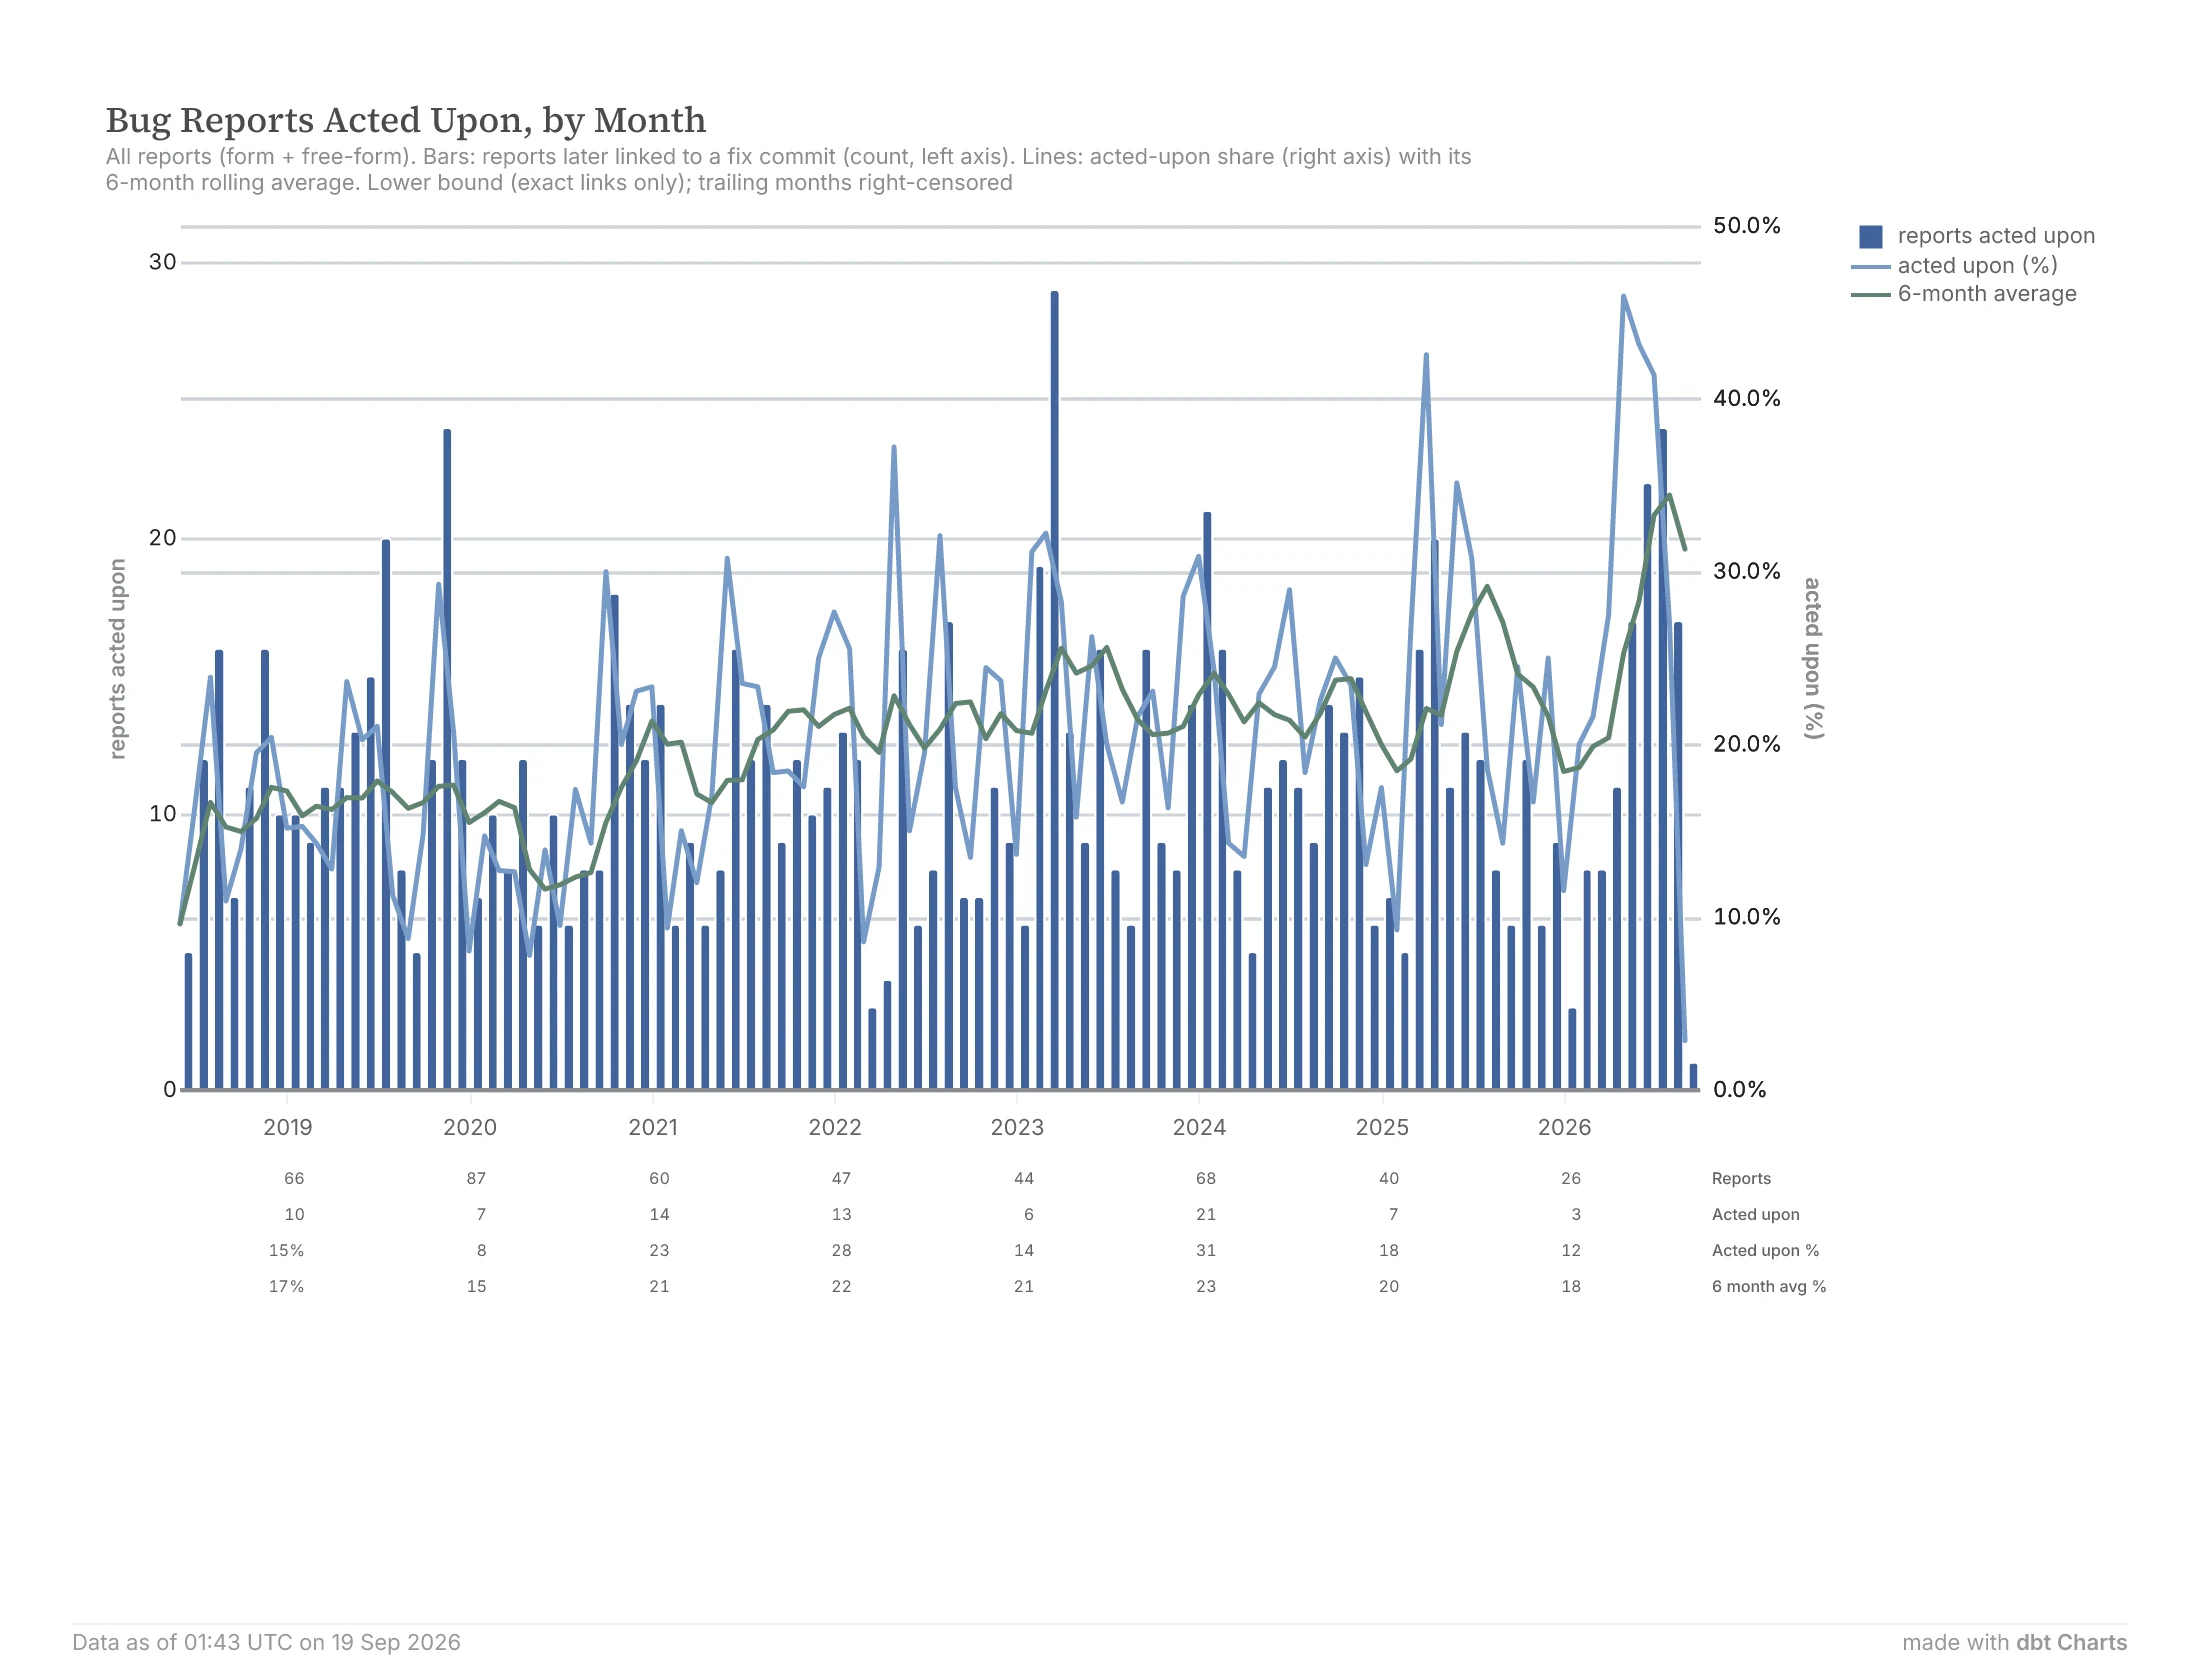
This report shows, by month, the number of bug reports acted upon, the % of total acted upon, and the 6-month average of % acted upon. The table at bottom also includes the total number of bug reports made. The table at bottom only shows the numbers every three months as there isn’t enough space to show every month even though the chart itself is showing data every month.
We are seeing both the monthly % of bug reports acted upon and the 6-month rolling average jump to unprecedented levels, starting in May 2026. The monthly % tended to run between 15 and 30%, and, starting in mid-2021, the 6-month rolling average between 20 and 25%. There was one jump of the 6-month rolling average to almost 30% in mid-2025 but it dropped back down again. Now, we are seeing the % acted upon spike as high as 46% (in May 2026) and the rolling 6-month average meaningfully above the 30% threshold, reaching as high as 34%, in August 2026. Also relevant to note is that the most recent bug reports have had less time for their fixes to land than earlier bug reports, say in 2023 or 2024. So the last one or two months might actually be a bit low.
Is this jump in the share of bug reports acted upon because higher-quality, more real bugs are being reported? Or perhaps because it’s easier for Postgres developers who receive the bug reports to triage, examine, and develop fixes with LLM assistance? Or another factor? It’s difficult to be sure based on this evidence, but I do feel reasonably confident in saying that this does show LLM impact on the overall project.
Lines of Code Churned
One other way we could see if there’s been a meaningful impact to code in the project caused by LLMs is to measure the volume of changes being made to the codebase in terms of lines of code (LoC) added and LoC removed. LoC is a contentious metric in the software world because many companies have attempted to use it as a productivity metric for software development. It’s very unreliable for that purpose because the absolute meaning of one line of code can vary wildly between software projects, teams, languages, purposes, and individual developers. However - I do think that it’s a valid use to measure LoC in a time axis over the same software project because all you’re assuming in that case is that the relative complexity and impact of an average line of code has some consistency over time in the same software project. So if you see LoC additions and removals shrink or grow significantly over time, in the same software project, that’s probably an indication that there has been significantly less or more work, respectively, to that same codebase.
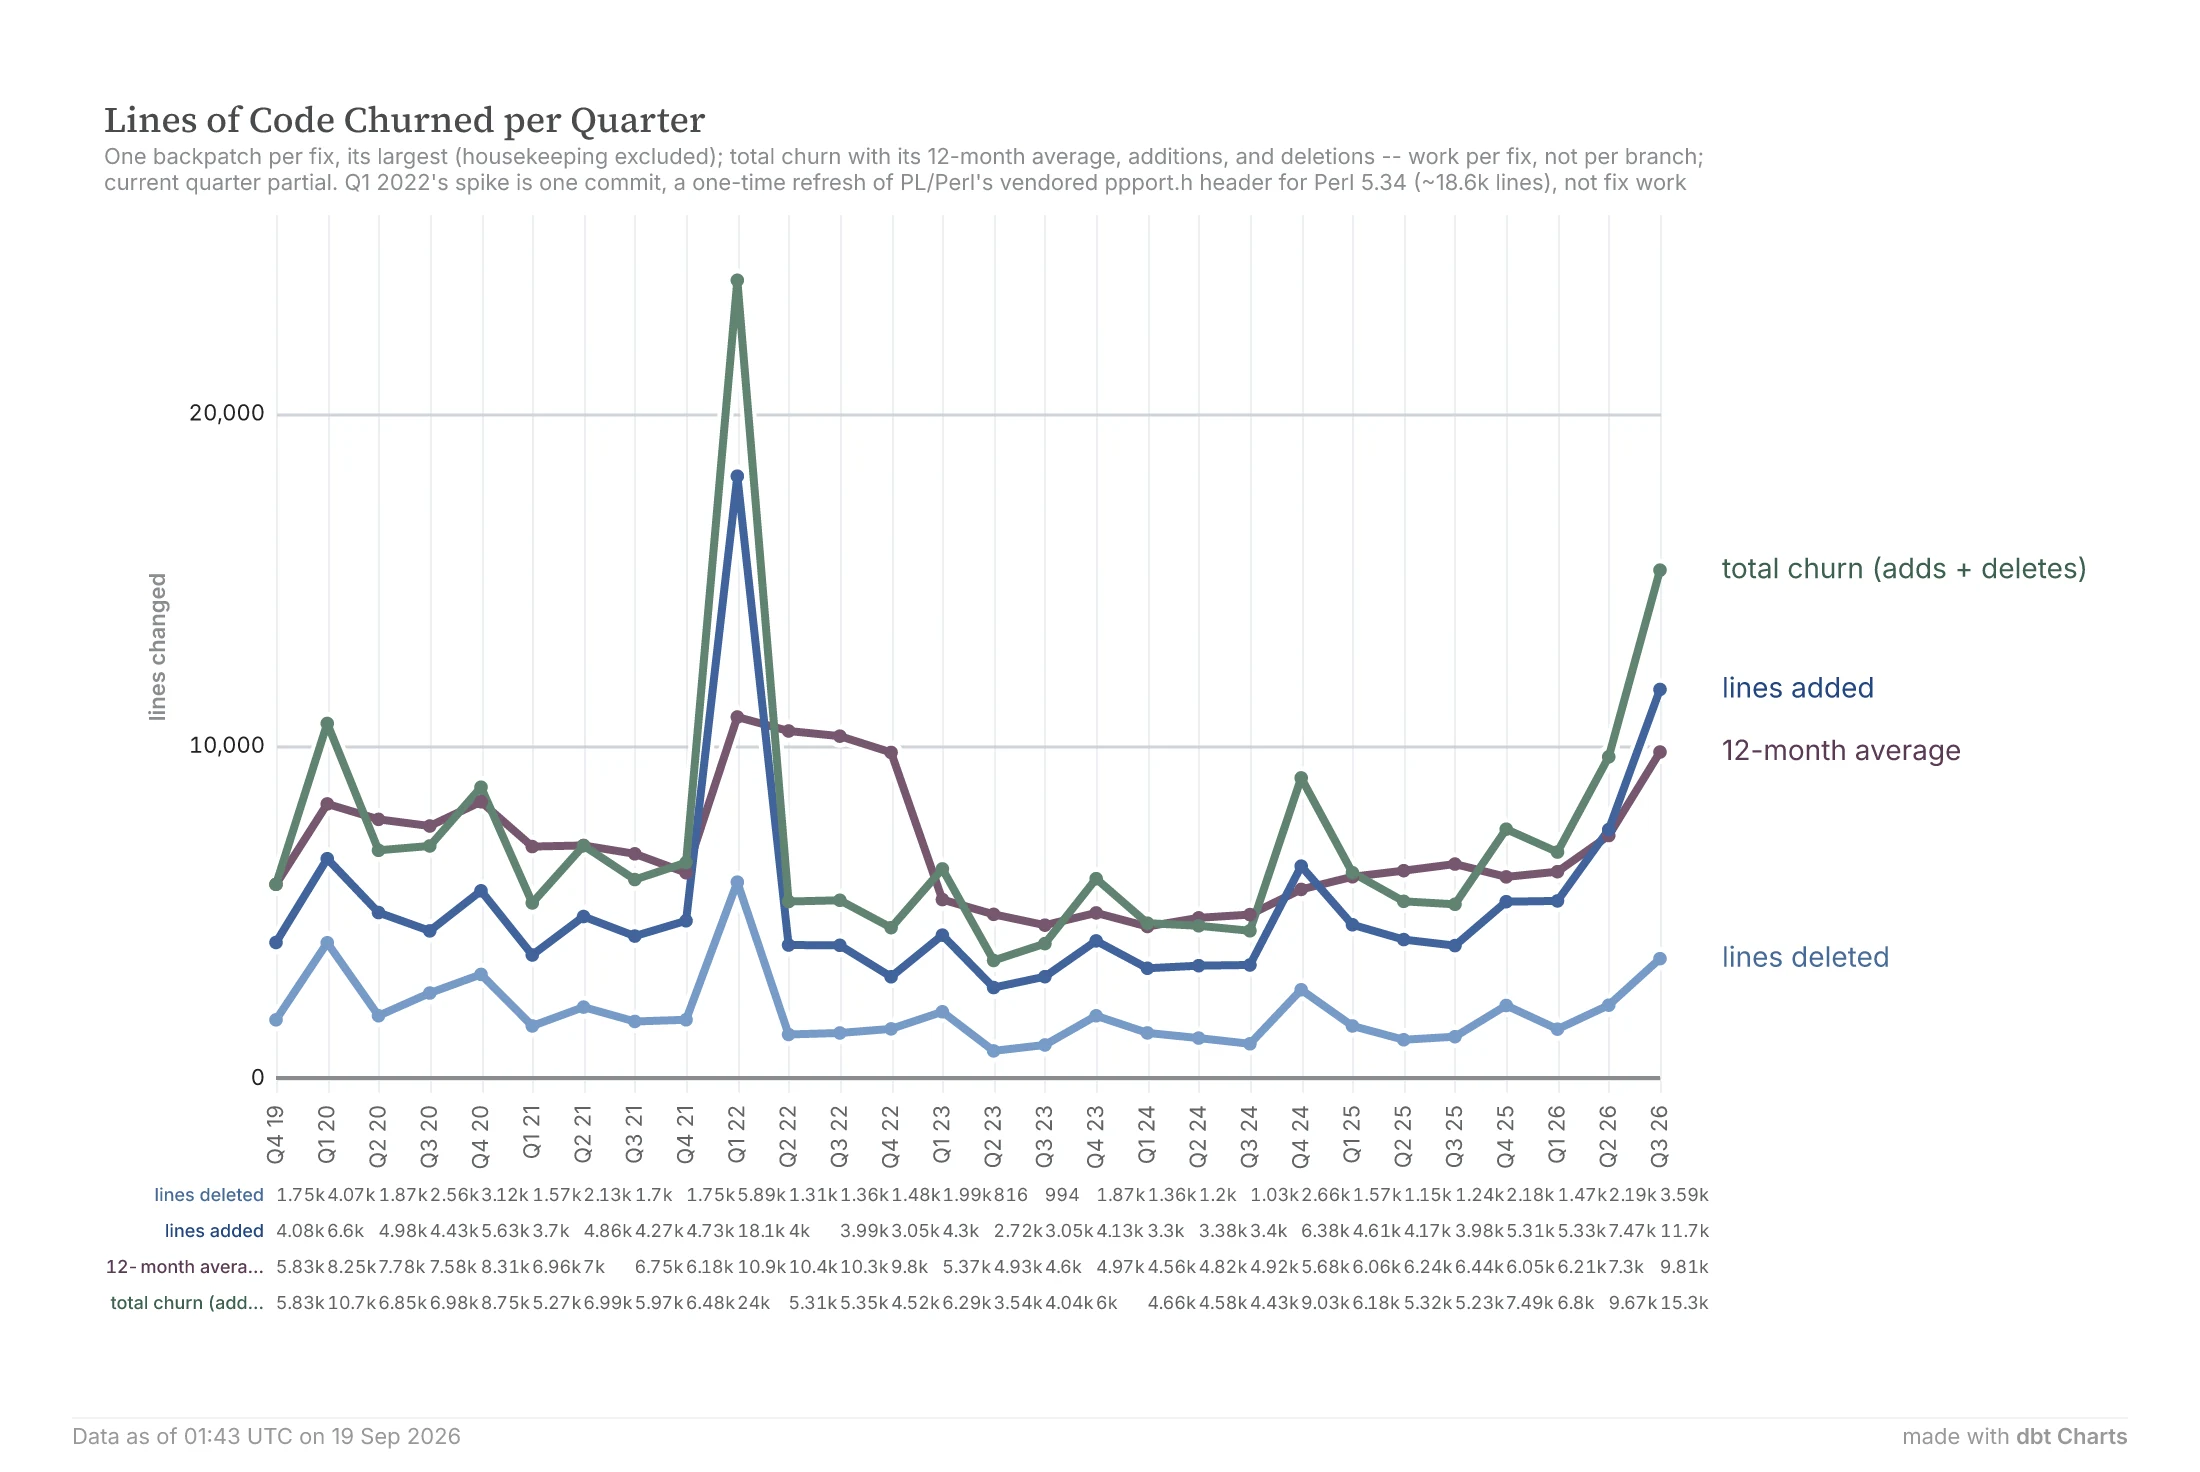
What we see here is some level of movement, with one big spike in Q1 2022, but generally staying in the 5 to 7K LoC churn/change per quarter range. I had Claude do some investigation, and the one big spike was caused by a one-time refresh/update of Perl support which caused a large codebase size change. Almost all of that commit’s 18,600 lines are one auto-generated Perl-compatibility header written in C (ppport.h) being refreshed, not manually written code to address a bug. So that’s an outlier that for the purposes of our analysis isn’t relevant. Q1 2020 was also elevated (10.7k) but dropped back the next quarter.
Q2 2026 does rise to the top of the historical range, and Q3 2026 goes past anything outside the Q1 2022 Perl-related outlier, even with two weeks still to run (I write this as of September 18th, 2026), so that last number will keep growing. Also, Q3 isn’t even complete yet so that last number will continue to grow until September completes. Also notable is that the largest commit in Q3 is a 2,077 line query planner rewrite fixing wrong query answers (Bug #19560) which states in its commit message that Claude wrote it.
So, if we wanted to understand what the current rate of churn is in LoC versus the historical average, what would that be? Turns out in Q3 2026 it is 212% of the historical average:
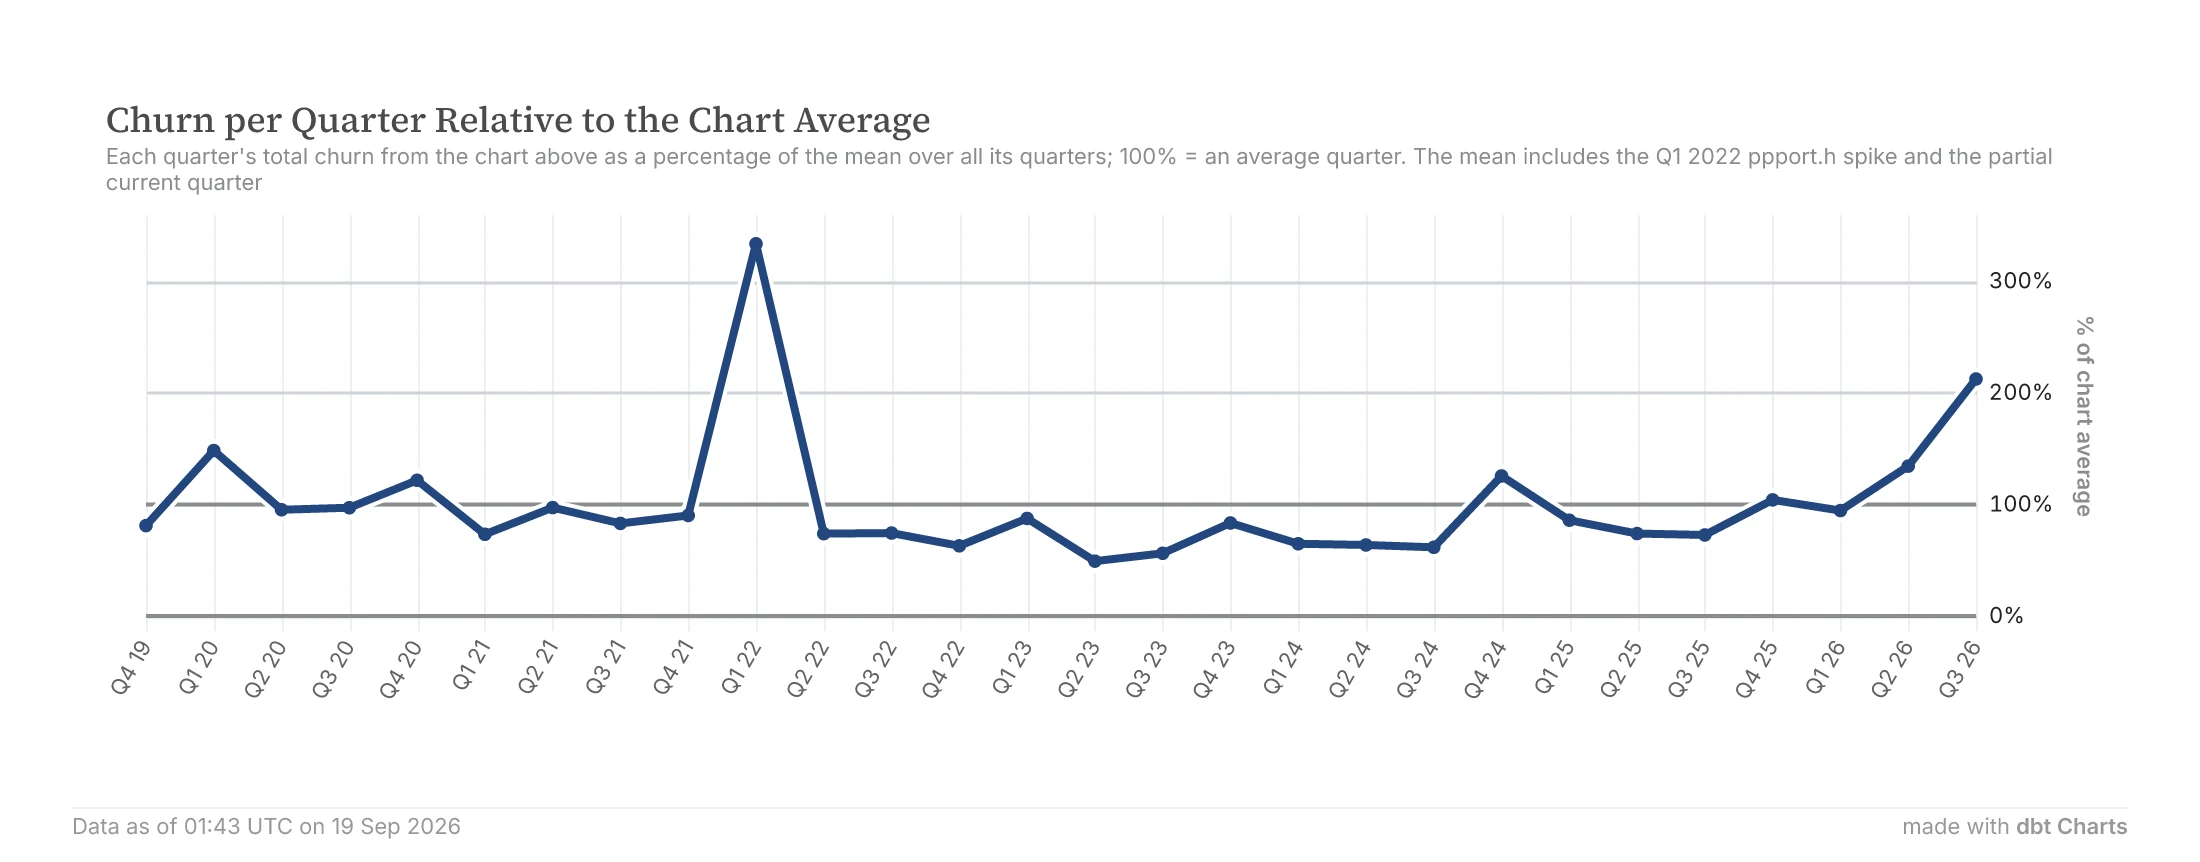
This is calculated based on the mean over every quarter in the chart, including the Perl spike in Q1 2022 and the partial Q3 of 2026. So, if anything, the churn per quarter should even be a bit higher than the simpler metric than we are using here. I’m not going to go too much further into that right now though because I think the 212% metric is already persuasive enough.
What the Evidence Says
Let’s review our findings to this point:
- Direct evidence of AI/LLM involvement
- AI-involved mailing list threads, disclosed directly in the content of the threads. The git commits say the same: 22 of the 26 fix commits that disclose AI involvement credit an AI tool with finding the bug (see the CVE section above).
- The Postgres project has no official policy on disclosing AI usage. The PGConf.dev 2026 developer conference discussed one, and noted that contributors fear disclosure could get a patch rejected. Therefore, there’s a good possibility that there is additional, undisclosed usage of AI for bug discovery, analysis, and writing code fixes, and thus that the rate of AI usage is higher than we can see through these metrics.
- Indirect evidence of AI/LLM involvement, based on changes in various metrics in Q2 and Q3 of 2026:
- Volume of changelog fixes by quarterly release doubling (the August 2026 release versus the May 2026 release)
- Count and proportion of CVEs by release
- LoC churn
- Share of bug reports acted upon, by month
We don’t have evidence either way in terms of raw volume of mailing list traffic or raw volume of bug reports.
One other thing I didn’t get into in this article was the actual content of Postgres mailing list threads and commits I’ve been reading as part of this research. The general trend is that LLMs are definitely having a significant impact on development and are being used as a bug discovery, analysis, and remediation tool by many users and developers. This isn’t as rigorous a finding as the other numeric measurements in this article, but at the least this anecdotal evidence doesn’t give any reason to doubt the analytical conclusions.
Our original questions, along with answers:
- Are LLMs/AI finding more bugs more quickly than was previously happening without AI assistance?
- Yes, it seems very likely.
- Are these bugs not just “slop” bug reports and/or very rare corner cases, but actually representing real issues that need to be addressed?
- The bugs and vulnerabilities being reported are real and significant, and are being addressed and fixed by the project.
- Can we measure the specific impact of these trends over time? Are the number of bug reports and fixes increasing 50%? 100%? 200%?
- There are a lot of metrics through this blog post, and so I’m not going to go back and repeat every one. A few that do pop out:
- The changelog for the latest Postgres minor release, 18.6 in August 2026, has double the entries versus the previous minor release, 18.4, in May 2026.
- By August and September 2026, 8% of new pgsql-hackers and pgsql-bugs mailing list threads disclose AI involvement, up from under 1% before June. Additionally, there’s the potential for more unreported AI usage.
- LoC churn in Q3 2026 at more than 200% of the mean quarter since late 2019.
- There are a lot of metrics through this blog post, and so I’m not going to go back and repeat every one. A few that do pop out:
So, yes, AI and LLMs are having a significant, documented impact on Postgres development, and it’s likely that the same thing is happening across the entire open source ecosystem.
What Comes Next
The next question is: “Can we use past trends to predict the future? Will this trend continue, and will greater numbers of bug reports be made, more LoC churn, larger and more security-impacted change logs per quarterly release?” My gut feeling based on our findings is that “Yes, Postgres’ elevated pace of development, code churn, changelog volume, and bug fixes is going to at least continue at this level for at least a year or two, and it might increase even more.”
Greg Kroah-Hartman came to a similar conclusion about the impact of LLMs on open source software development in his presentation here: Linux in the Land of LLMs. His points, roughly:
- That the genie is out of the bottle regarding LLMs and their capabilities
- No, it isn’t the end of the world. We can manage it, but we have to change and use the new tools (LLMs)
- Expect elevated bugfix and security vulnerability rates for a while until we get the codebases up to the new standards
- There are some exciting new possibilities as well, it isn’t all doom and gloom
There are some similarities between Postgres and Linux kernel development that may not apply to other software projects. They both are long-running projects with pre-existing structure and governance mechanisms, including source code management, patch review processes, release schedules, and significant existing volunteers and staff. Software projects that don’t have this in place, including smaller and less well-organized open source projects and also commercial closed-source projects, may have a harder time adapting and be more easily overwhelmed. If you’re a technology leader and considering which software projects or dependencies to include in your tech stack, I’d suggest taking a closer look at the rate of bug reporting, triage, and fix issuance. It’s likely to be a more challenging time to start or run smaller and less well-resourced software projects because you’re likely to have a flood of vulnerability and bug reporting that you need to be prepared to manage.
Doing a more rigorous statistical trending analysis to back up my intuition about future growth is another significant chunk of work. I feel like this has already been a lengthy blog article, and we’ve arrived at a good stopping point. As time permits, I’ll return to this theme and take up the question of the future.
The Code
All the code for data ingestion, analysis, transformation, and the data visualizations that were used in this article is available in this repo that I am making available as open source and that I’ll likely continue developing and extending. You’re welcome to file issues and even submit pull requests!
If you felt this article was useful, and would like help implementing analytics and AI in your organization to make your decision-making simpler and more reliable, reach out to us at Dorian Insights!
Disclaimer
I wrote this article myself, by hand. “Writing is thinking” to me, and I don’t want to lose my ability to think by delegating it to AI. I did use AI to review and critique my article after I drafted it, and I did incorporate a significant number of its suggestions. Also, a good proportion of the underlying codebase used to ingest the data, do the cleansing and transformations, and create the charts, was written by Claude. I did write a good chunk of the code myself, I architected the solution and designed the data model, I asked the questions, and I read most of the code. This wasn’t “vibe coded.” Part of the point of this coding project was to explore productivity augmentation with AI-assisted development and a properly configured harness while at the same time making sure the developer (me, in this case) ultimately retains control and responsibility.